


Read Time:
7
Minutes
Digital Transformation & Innovation
April 13, 2026
Navigating the Adoption Process of Technology Innovation: The S-Curve Model as a Strategic Tool
Technology has long been the driving force behind economic progress and social change. However, the journey from a technological concept to an impactful innovation is often fraught with challenges. One tool that has emerged as a reliable guide for organisations in this journey is the S-curve model.
Introduction
The concept of the S-curve or logistic curve, in the context of growth and innovation, is often attributed to various fields like biology, sociology and economics. However, the popularisation of the S-curve in the realm of technology adoption and innovation is largely credited to Everett Rogers, a professor of communication studies. His seminal work, "Diffusion of Innovations" first published in 1962, brought the concept into mainstream academic discourse and business strategy. Rogers work was ground-breaking in its integration of the S-curve model to understand how, why and at what rate new ideas and technology spread through cultures.
The model presents a graphical representation of technology adoption and maturity over time. This article delves into technology innovation, its relationship with organisational strategies and how the S-curve model can be an invaluable instrument for steering the adoption process.
What is Technological Innovation?
Technological innovation is a subset of innovation. Innovation in itself can cover various disciplines. At Ntegra, we view technological innovation as a multifaceted construct that hinges on the interplay between technological products and services and the innovative processes within an organisation. When organisations aim to innovate, they must ensure a harmonious balance between these two elements.
This is important to both us and our clients as Ntegra’s unique Innovation Programme offering is a dedicated blend of technology and innovation through our flagship tech summits and consulting engagements that bring together technology and innovation in a combination that is most appropriate for our clients.
Innovation is about the effective application of technologies in ways that solve real-world problems or create new opportunities. It is, therefore, important to recognise that a successful approach to technological innovation involves more than the mere creation of new technologies; it also encompasses the processes, methodologies and systems that govern how these technologies are brought to market. Companies like Google and Tesla exemplify this interplay. Google not only revolutionised search algorithms but also established unique organisational practices that encourage continuous innovation. Tesla, on the other hand, innovated not just by creating electric cars but by rethinking the entire supply chain and distribution model.
The S-Curve Model: A Guide to Adoption and Maturity
The S-curve provides a systematic framework for understanding the lifecycle of a technology. It has four primary phases:
Introduction: Slow initial growth characterised by high investment costs and limited adoption. For example, 3D printing technology existed for decades but was initially slow to be adopted outside of specialised industries.
Growth: Rapid adoption due to increasing awareness and improving cost-efficiency. Smartphones experienced this phase during the late 2000s, when they transitioned from business luxury items to consumer staples.
Maturity: Saturation in the market, marginal improvements in the technology. The PC market exemplifies this phase, where the technology has become ubiquitous, and the pace of fundamental advancements has slowed.
Decline: Gradual phasing out or replacement by new technologies. An example includes the pager, which was widely replaced by mobile phones.
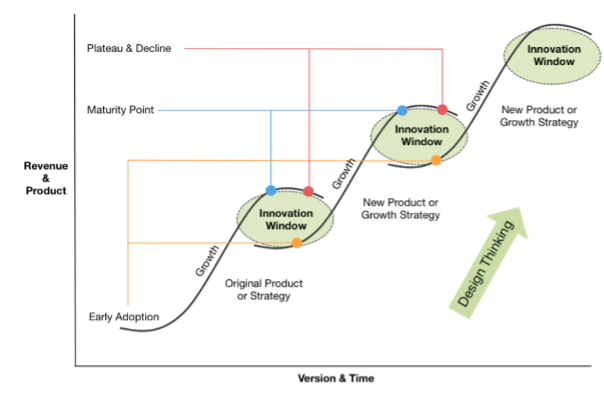
The curve gets its name from its 'S' shape, which portrays technological adoption starting slowly, picking up speed, and then slowing down as it reaches saturation. While there may be many factors contributing to its market decline, generally as technology advances, it eventually becomes cheaper, faster and more efficient.
As this happens, the competitive advantages of using it become less and less, and other companies are able to catch up. Inevitably, the technology reaches its technological limit and is no longer a competitive advantage. Typically, around this point, there may be a radical innovation change in the technology resulting in a new S-curve.
It is possible to predict, manage and solve barriers and system dynamics at each of these phases. By understanding the various phases of the lifecycle, stakeholders can stay ahead of the curve by monitoring the changing dynamics of innovation and developing strategies to adapt and capitalise on opportunities before they become saturated. They can also identify potential barriers and system dynamics that may impact their success and develop strategies to mitigate them. Generally, the fastest movers will stand to capture the biggest rewards, and the slowest movers will be left with the biggest losses.
Categories of Adopters: A Framework by Rogers (1962)
Rogers did not solely focus on the S-curve but also introduced the idea of categorising adopters of new technologies into different types (innovators, early adopters, early majority, late majority and laggards), thereby giving us a more nuanced way of understanding the S-curve in technology adoption. These categories, crucial in shaping the S-curve, are:
Innovators (2.5% of adopters)
Innovators are the first individuals to adopt a technology. They can be identified as the risk-takers and are usually well-connected with other innovators. Their financial resilience allows them to absorb the high costs and risks associated with being an early adopter of new technologies.
Early Adopters (13.5% of adopters)
Early adopters follow innovators and are characterised by their openness to new ideas and their leadership roles within communities. They serve as opinion leaders and are more cautious compared to innovators but are still willing to take calculated risks.
Early Majority (34% of adopters)
This group adopts new technologies just before the average person. They often need to see proof and practical benefits before making an adoption decision. Their caution serves as a gatekeeping function, ensuring that a technology is genuinely useful before broader community adoption.
Late Majority (34% of adopters)
The late majority can be seen as sceptics who only adopt a technology after it has been tried and tested by the early majority. They are risk-averse and would prefer to follow proven paths rather than pioneer new ones.
Laggards (16% of adopters)
Laggards are the last to adopt an innovation and are generally resistant to change. By the time they adopt a particular technology, a new one often supersedes it.
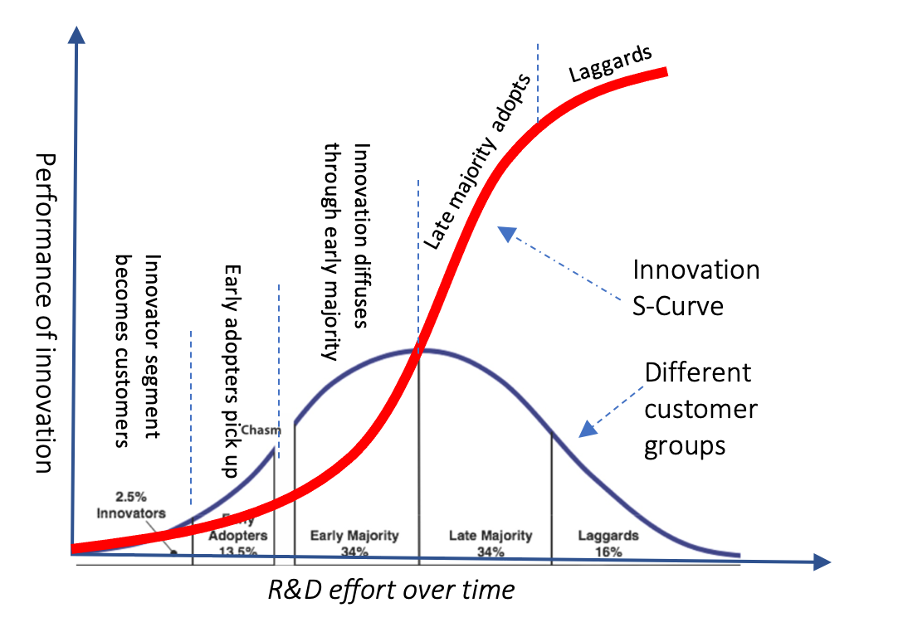
Each adopter category contributes to shaping the S-curve. Innovators and early adopters help initiate the curve, pushing it from the flatline of obscurity into the growth phase. The early and late majorities contribute to the rapid upward trajectory and eventual plateau, while laggards often come into play as the technology reaches maturity or even starts to decline.
Rogers’ work has had a profound impact on fields like marketing, organisational behaviour, and information systems. Understanding these categories enables organisations to tailor their marketing and product development strategies. For example, tech companies often offer 'beta' versions of their products to innovators and early adopters, leveraging their feedback for improvement before a broader release.
Practical Use-case Examples in Navigating the S-Curve
Predicting Inflection Points
Kodak, once a leader in photographic film, missed its inflexion point and failed to transition to digital technology effectively. In contrast, companies like Adobe shifted their business models in time. Adobe transitioned from boxed software to cloud-based solutions, recognising the evolving needs of the market.
Preparing for Multiple S-Curves
The IT industry is an excellent example where multiple S-curves can be observed. The transitions from mainframes to personal computers and then to cloud computing, represent different S-curves. Companies like IBM have successfully navigated multiple S-curves by continuously evolving their business models.
Balancing Technology and Process
Netflix serves as a model case study for organisations that have not only adopted new technologies but also adapted their business processes. The transition from a DVD rental model to an online streaming service required not just technological changes but also a rethinking of customer engagement, content procurement and distribution strategies.
Conclusion
Innovation is a complex endeavour that involves the right blend of technological acumen and process refinement. Whether you choose to embark on the journey on your own or with a trusted partner like Ntegra empowering you every step of the way, by understanding where your organisation lies on the S-curve, you can make informed decisions on technology adoption, investment and operational changes. As a result, the S-curve model serves as a powerful, strategic tool for organisations looking to not merely survive but thrive in today's competitive landscape.
References
1. Rogers, Everett M. (1962). "Diffusion ofInnovations". Free Press.
2. Christensen, Clayton M. (1997). "TheInnovator's Dilemma". Harvard Business Review Press.
3. "Adobe Systems: Transitioning to theCloud". Harvard Business School Case.
4. "IBM's Decade of Transformation". Harvard Business School Case.
5. "Netflix: The Online Pioneer Reinvents Itself". Strategy+Business Magazine.
If this resonated, explore Ntegra’s Knowledge Hub for deeper strategy insights, market trends and pragmatic thought leadership.
Ntegra's 5 Key Principles for a Successful Intranet
Autumn Tech Summit 2021 Highlights
Ntegra Coffee Club – February 2022
Andreessen Horowitz - London Roadshow
Product Led Growth is the De Facto Strategy and Operating Model
Technical Perspective on Artificial Intelligence within DevOps
Venture Capital and Corporate Innovation - A Point of View From Mayfield Fund
Ntegra's Journey with AI at the Northumbrian Water Innovation Festival 2023
Navigating the Adoption Process of Technology Innovation: The S-Curve Model as a Strategic Tool
